Milestones
Foord Asset Management has been engaged in consistently growing retirement savings since 1981.
The company offers a premium investment management service to long-term investors in retirement funds and unit trust portfolios. A multi-decade track record of successful investing evidences Foord’s ability to consistently deliver superior investment returns for a range of investment strategies.
- As an independent and owner-managed business built on the principles of investment stewardship, we place investors’ interests ahead of our own
- We construct diversified investment portfolios based on rigorous fundamental research, high conviction ideas and an adaptable, value-driven investment policy
- We embrace market volatility as opportunity, not risk.
THIRTY YEARS OF INVESTMENT MANAGEMENT EXCELLENCE
Foord has recently achieved the important milestone of an uninterrupted thirty-year investment management track record in managing retirement fund mandates. This track record of investment management excellence evidences the firm’s ability to consistently deliver superior investment returns to long-term investors.
In an industry flooded with past performance information, usually focused on very short-term histories, it is refreshing to reflect on a truly long-term, repeatable investment history. Importantly, the investment philosophy, people and organisational structure underlying this history has been consistent for so long.
Indeed, in Dave Foord the firm has had the same Chief Investment Officer for over three decades. The founder and management are pleased that Foord’s disciplined approach has been able to make such a substantial contribution to the long-term savings of our many investors.
LONG-TERM ALPHA
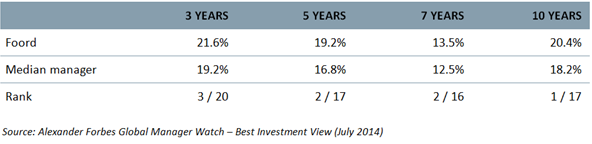
Over the last thirty years, Foord’s Global Balanced investment strategy (suitable for retirement funds) has delivered a return of 21.4% per annum against an average annual inflation rate of 8.3% per annum. This represents a real return of 13.1% per annum for thirty years.
By comparison, the average pension fund return over the period was 17.3% per annum (calculated using data from the Consulting Actuaries Survey up to December 1997, thereafter the average of the Alexander Forbes Large Manager Watch). Foord has outperformed this peer group average by 4.1% per annum.
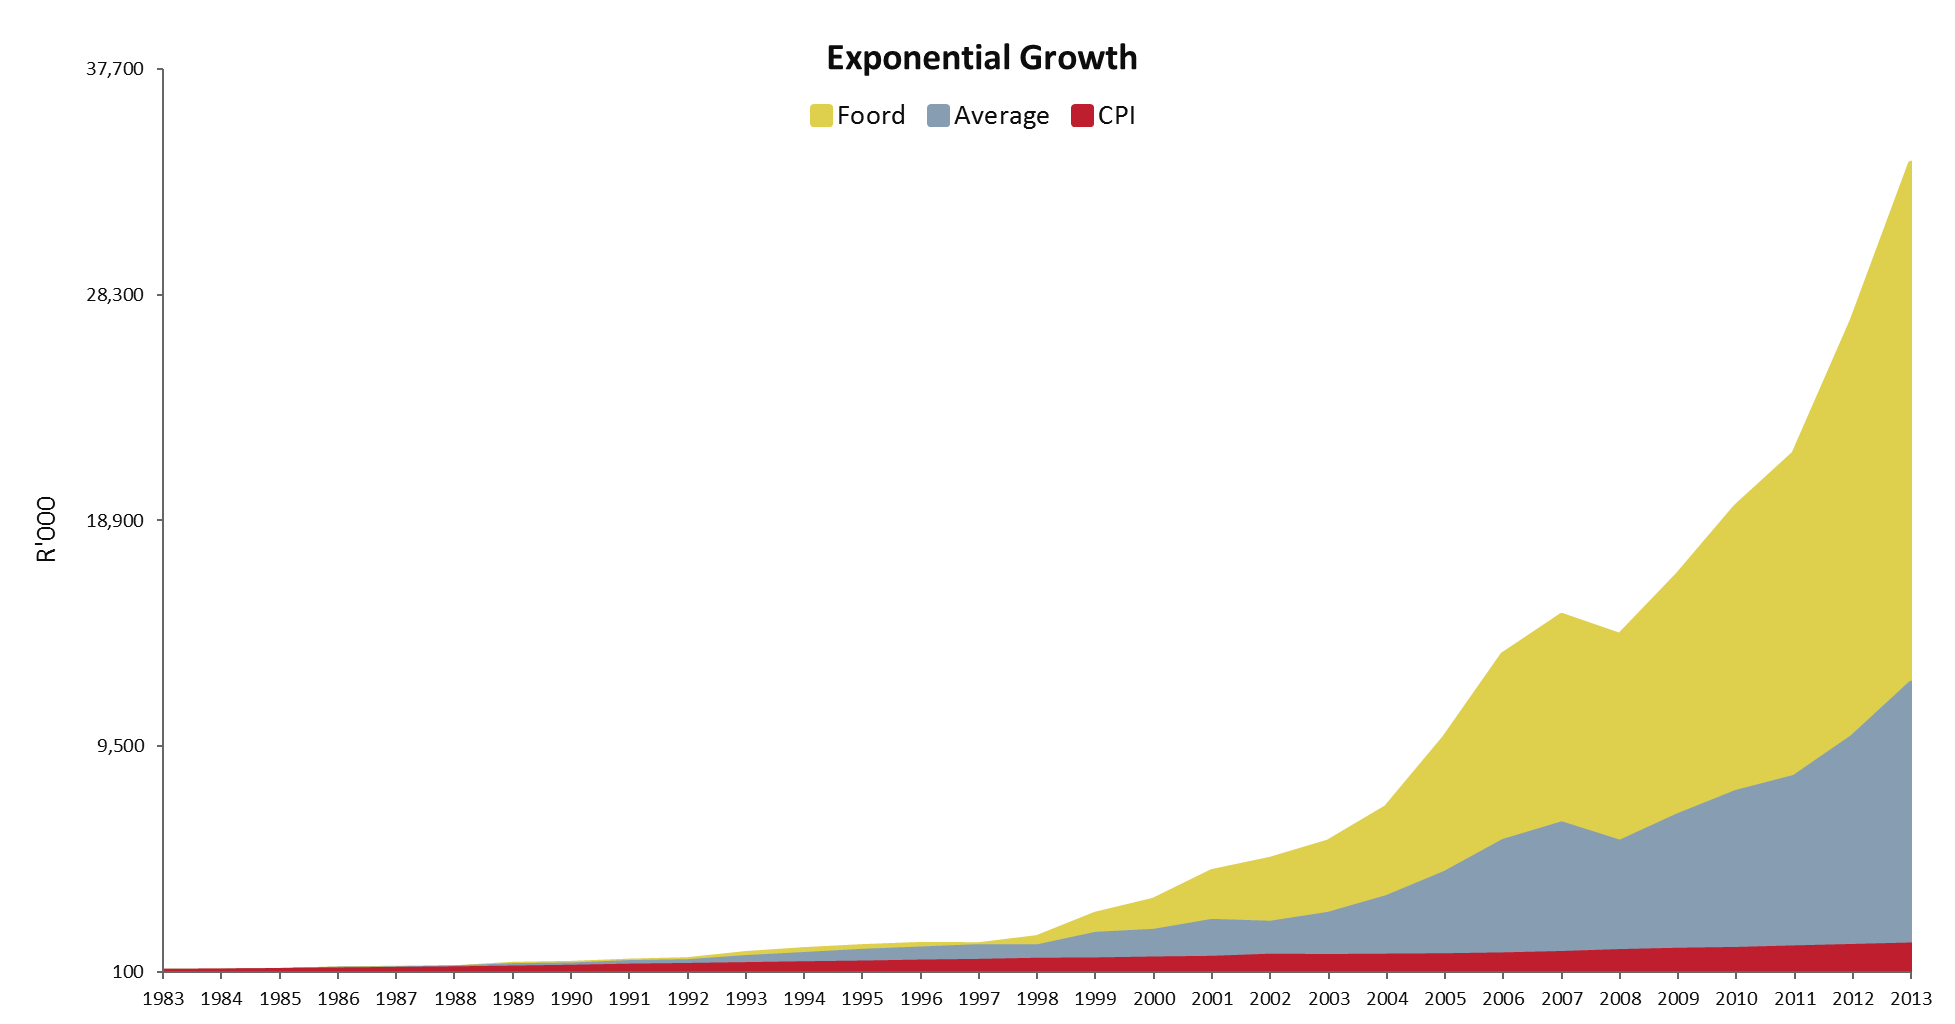
A R100,000 investment in the Foord Global Balanced investment strategy thirty years ago would be worth around R34 million today, while the inflation-adjusted value of that R100,000 would be approximately R1.2 million today. By comparison, the R100,000 would be worth R12.1 million today if invested in the average retirement fund. The exponential-like return profile is illustrated in the following chart where the vertical axis has purposefully not been subject to logarithmic adjustment.
LONGER TIME HORIZONS IMPROVE PROBABILITY OF REAL RETURNS
The importance of investors (and their advisors) using the correct time horizon when considering investment strategy cannot be over-emphasised. In our experience, investment decision-making governance frameworks suffer a number of shortcomings. Most importantly, too much of the decision making process is devoted to analysing short-term performance metrics (both in absolute and peer relative terms). This is notwithstanding the very long-term nature of wealth accumulation and retirement saving.
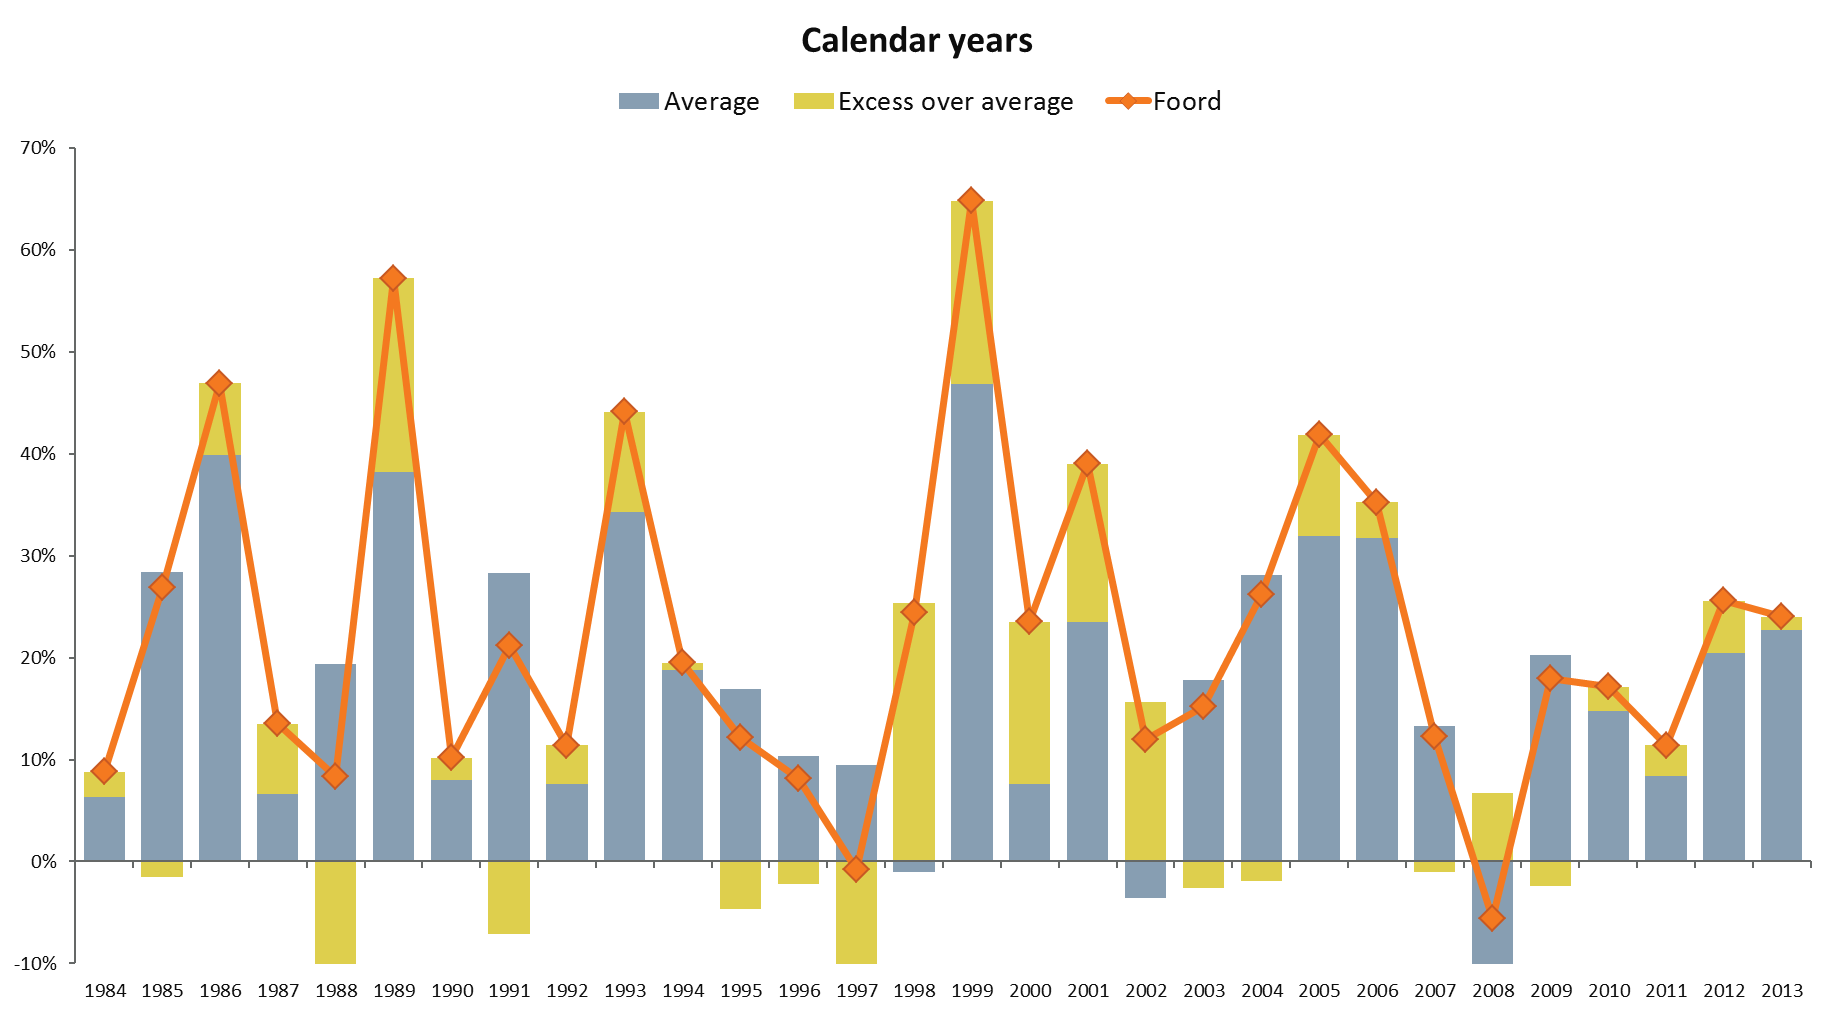
Contrast potential investor reactions to the following two charts. The first shows Foord’s thirty-year track record over calendar year periods whilst the second shows the same history over rolling ten calendar year periods.
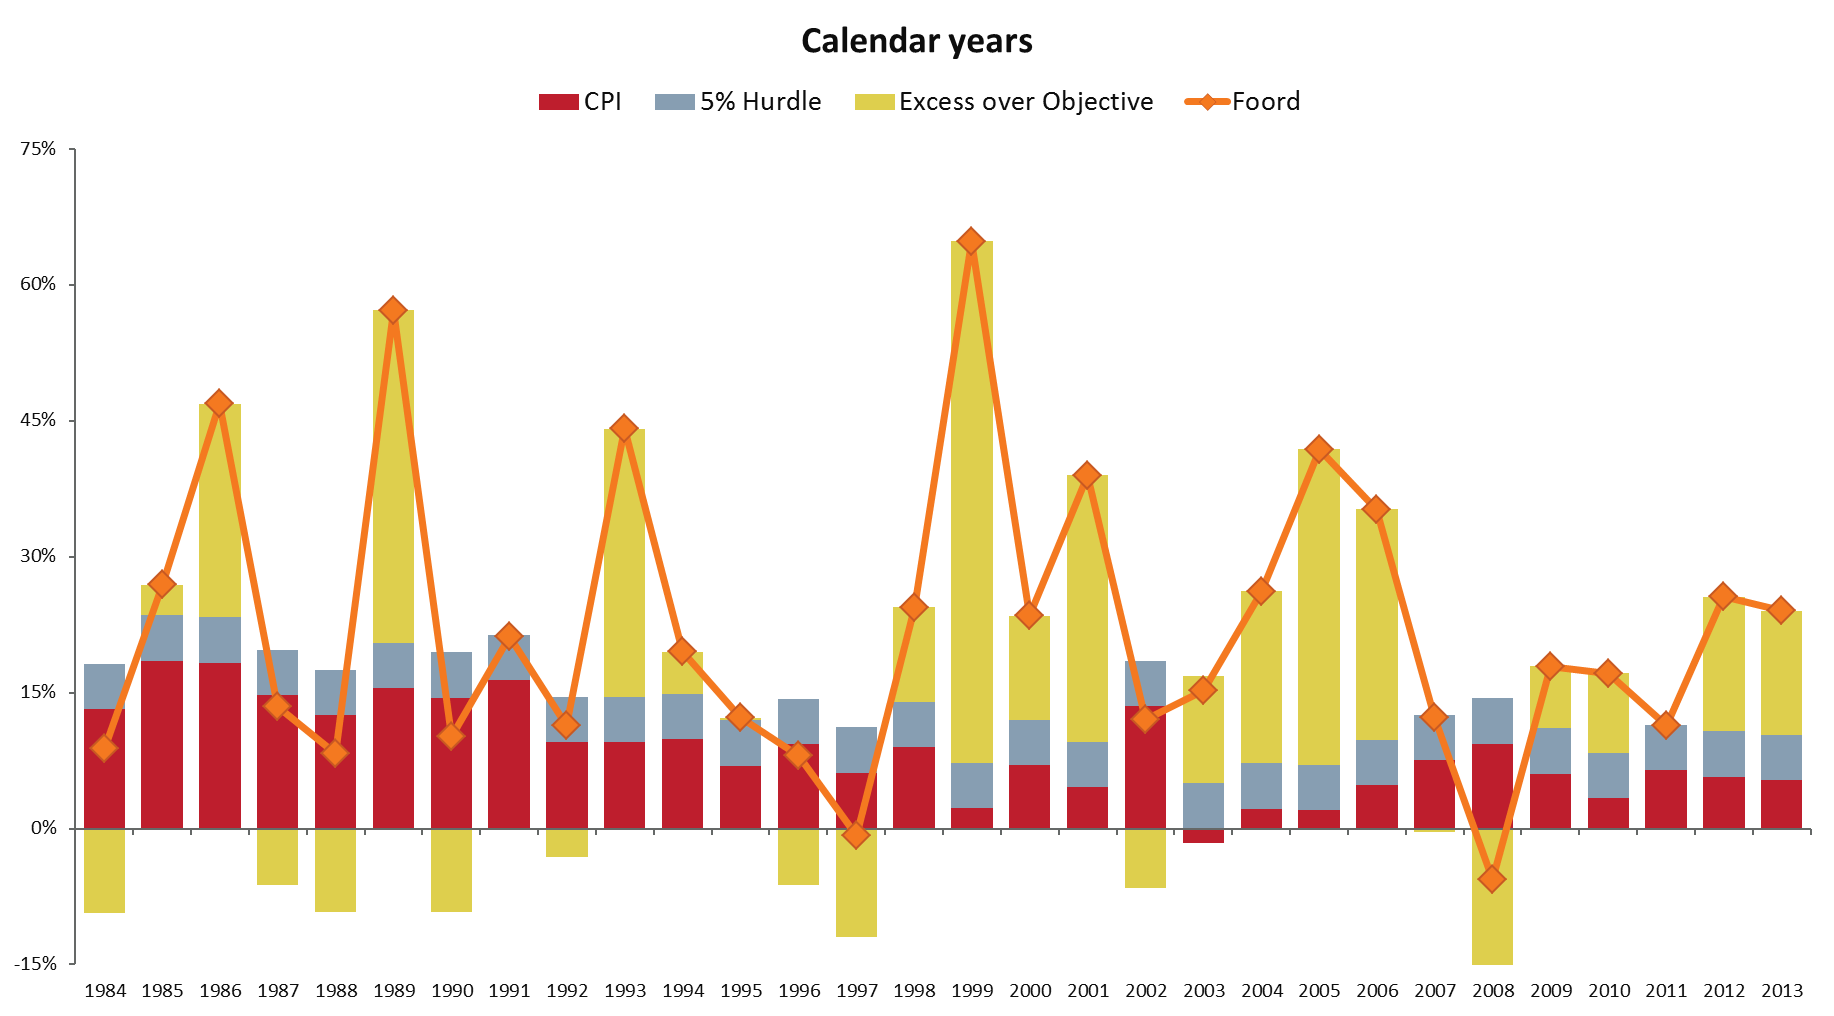
The chart shows that Foord’s returns have been negative in only two of the thirty calendar years presented. The returns trail behind inflation in eight of the thirty years under review. Investors who placed too much emphasis on protecting against these rare short-term drawdowns, did so to the great detriment of their long-term investment results.
Sadly, this focus on short-term performance is highly prevalent in the South African investor community. As long-term investors, our investment decisions are based on an investment horizon of at least five years. And, like Warren Buffet, our favourite holding period is forever.
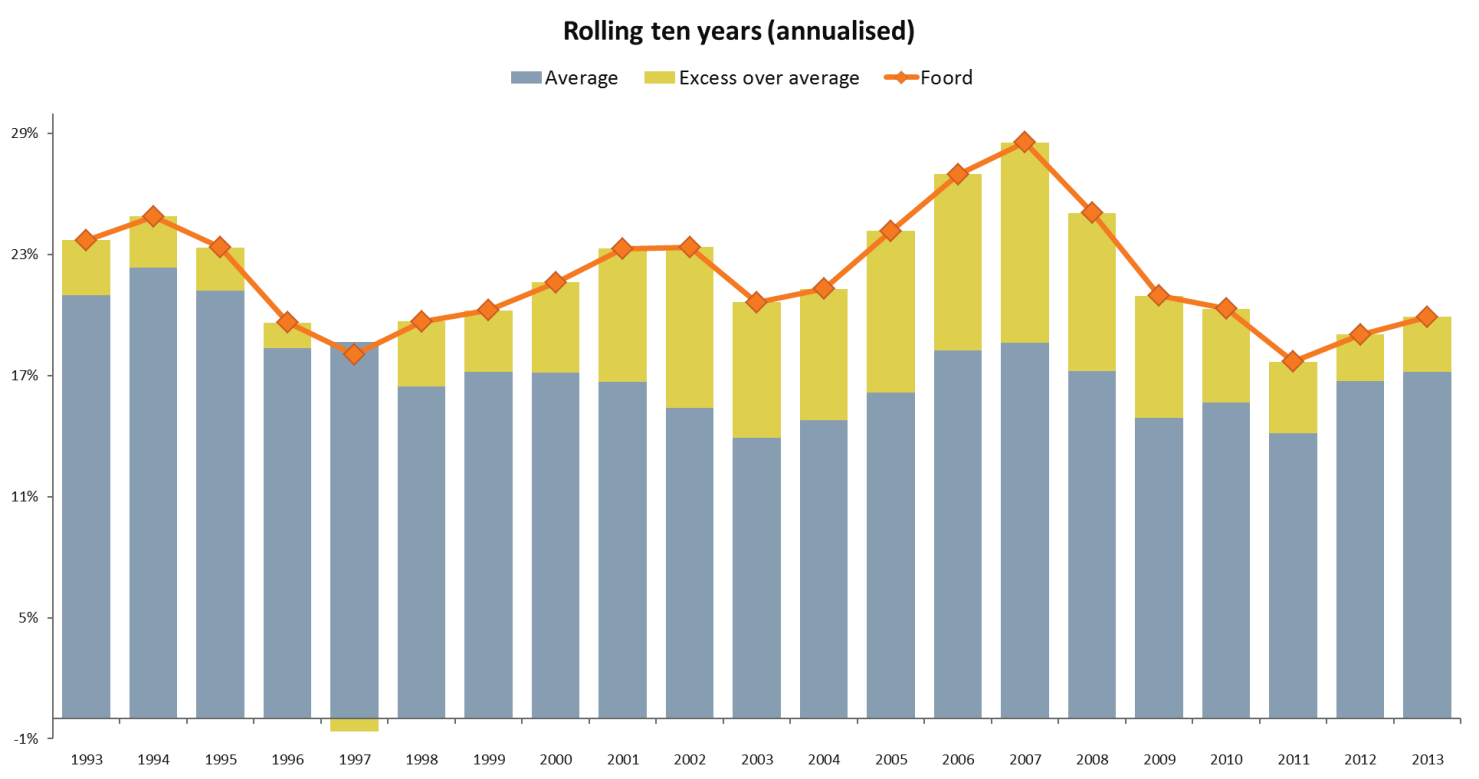
The following chart reflects the same set of investment returns measured over rolling ten-year periods. It is striking how much “smoother” the investment outcome becomes when we consider the results in the context of an appropriate long-term period. The average investor would perceive this set of returns as significantly less risky. The reality is that both charts convey the same performance track record and thus deal with the same risks.
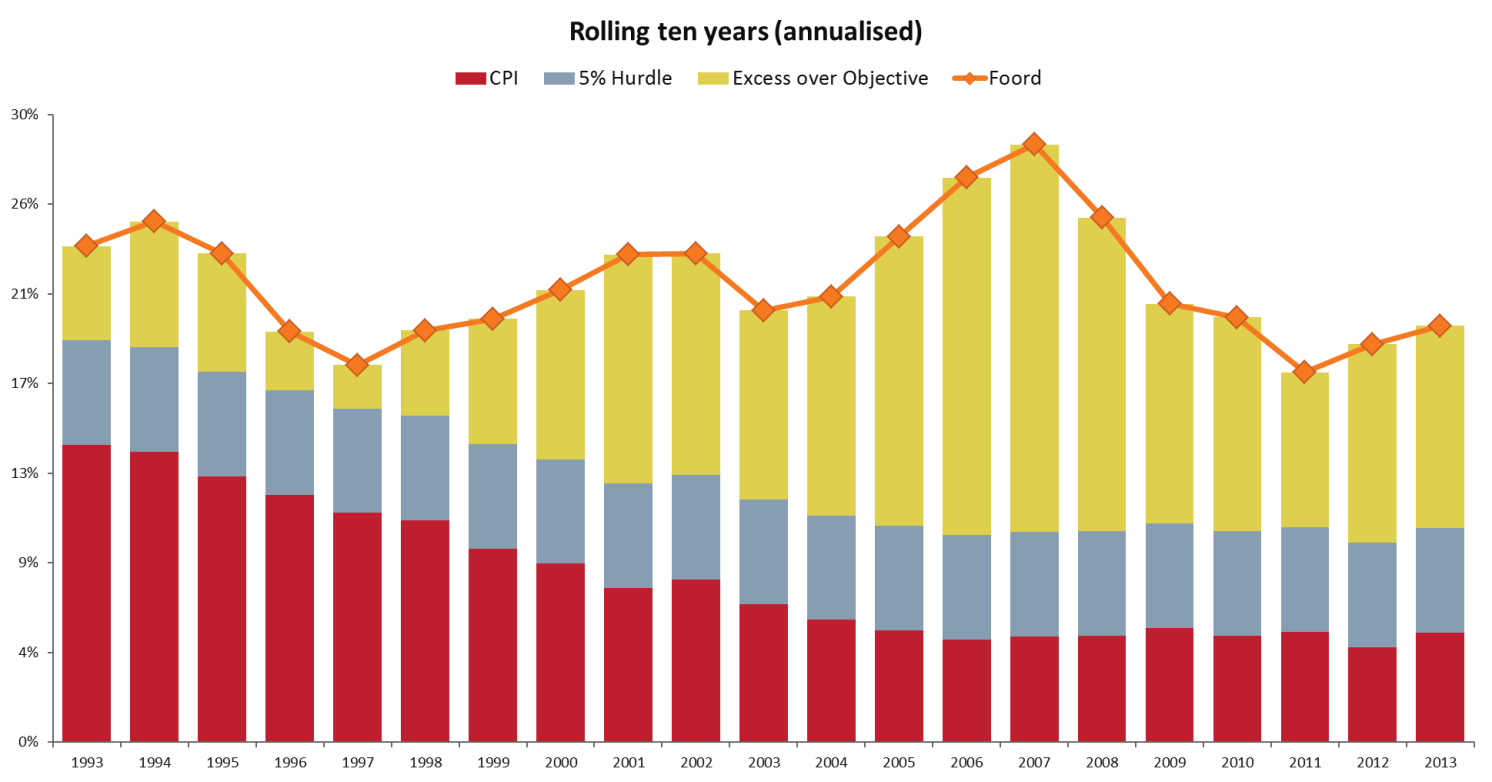
Additionally, the chart shows that there has not been a single rolling ten year period in the last thirty years that the Foord Global Balanced portfolio has not exceeded its CPI+5% investment objective. The rewards to good asset allocation and stock selection are significant for those investors with the discipline to maintain a long-term view – this is the core of our value proposition.
RELATIVE OUTPERFORMANCE DOES NOT COME SMOOTHLY
We see a very similar pattern when we consider the results in a peer group context. The following two charts show Foord’s thirty-year track record compared to the returns achieved by the average retirement fund. In ten of the calendar years analysed – a full one third – the returns achieved by Foord have been below the peer group average. In two periods (1995 – 1997; 2003 – 2004), underperformance has persisted for two or more years.
Taking a longer-term view, the following chart demonstrates that in only one of the 21 rolling ten-year periods presented has Foord achieved returns that are ever-so-slightly below those of the average retirement fund. This demonstrates that the long-term investment philosophy and emphasis on capital preservation consistently achieves desirable investment outcomes.
THE INVESTMENT ENVIRONMENT IN THE PAST 30-YEARS
The charts above showing the delivery of consistent long-term returns obscure the financial market volatility, major events and crises that fund managers had to manage and address. Just some of the key events that occurred during this track record are:
- 1984 – 1989: Pension funds required to hold prescribed assets
- 1985: Rubicon speech
- 1985-95: Financial Rand
- 1986-89: US Savings and Loans Crisis
- 1989-91: ANC unbanned; domestic violence breaks out; fall of the Soviet blocs
- 1991-92: US recession
- 1994: Democratic elections
- 1997: Exchange controls first relaxed; Asian Financial Crisis
- 1998: Pension Fund investment limits and parameters substantially revised (Reg 28)
- 1999-00: Dot.com bubble
- 2002-03: US recession
- 2008/2009: Global Financial Crisis and “Great Recession”
- 2010: China surpasses Japan as the world’s 2nd largest economy
- 2011: Eurozone sovereign debt crisis
ABILITY TO CONSISTENTLY DELIVER SUPERIOR LONG-TERM RETURNS
Although the success of our thirty-year track record is by definition backward looking, our investment philosophy and organisational DNA has not changed during this time. The implementation of the multiple-counsellor approach in 2009 whereby each portfolio is managed by two or more experienced fund managers (or “counsellors”) has resulted in continued top-ranking returns in multi-asset class mandates.
Foord’s twenty-two strong investment team, including seven experienced portfolio managers who have been with the firm for between seven and thirty-three years, is well positioned to continue delivering on the value proposition into the future
We look forward to celebrating many more important milestones with you.
Domestic Balanced Regulation 28 Multi-Asset Class Mandates
Global Balanced Regulation 28 Multi-Asset Class Mandates